VFACTS: December 2024

New Record for Vehicle Sales in 2024, but Challenges Loom for 2025
The Australian automotive industry is celebrating a record-breaking year for vehicle sales in 2024, but optimism is tempered by a challenging outlook for 2025. Economic pressures and stringent environmental regulations are set to test both manufacturers and consumers in the coming months.
A Record Year Amid a Shifting Market
December’s VFACTS report recorded 95,895 new vehicle sales, a 2.7% decrease compared to December 2023. Despite this, total vehicle sales for 2024 reached 1,220,607 – a 0.3% increase year-on-year and the highest annual figure ever recorded in Australia.
Tony Weber, Chief Executive of the Federal Chamber of Automotive Industries (FCAI), noted that strong sales in the first half of the year boosted the annual result. However, momentum waned in the second half as rising interest rates and living costs began to weigh on consumers.
“The second half of the year showed a concerning trend with sales in the Private segment falling to very low levels as interest rates and general cost of living pressures impacted Australian families.”
“Customers are also increasingly making choices regarding environmental outcomes and the associated total cost of ownership of moving to low emissions technologies. So, while the sales of battery electric vehicles are lower than expected, this is offset to a degree by an increasing number of buyers turning to hybrid and plug-in hybrid models,”

EV Sales and Environmental Pressures
While consumer interest in low-emission vehicles continues to grow, the uptake of battery electric vehicles (BEVs) has fallen short of expectations. BEVs represented only a small fraction of total sales, though hybrid (14.1%) and plug-in hybrid (1.9%) models offered some relief. Mr Weber said,
“The industry is responding to NVES by increasing the range of zero and low emission vehicles on offer. However, a continuation of current customer buying preferences will inevitably lead to the accrual of substantial penalties under the Government’s new scheme, which will create price inflation within the new vehicle market.”

Global Trends and Local Challenges
Australia’s slower-than-expected adoption of BEVs mirrors trends in other major markets like the UK, Europe, and the USA. Despite heavy investment in EV manufacturing, carmakers worldwide are struggling to meet emission targets as consumer demand lags.
Mr. Weber called for government action to support the transition to low-emission vehicles, including continued investment in EV charging infrastructure and the extension of consumer incentives such as the FBT exemption for plug-in hybrids, set to expire on 1 April 2025.
“If consumers do not want, cannot afford or cannot find new low emission vehicles that meet their needs, then no amount of effort from governments and car makers will make a difference.”
Market Leaders and Regional Performance
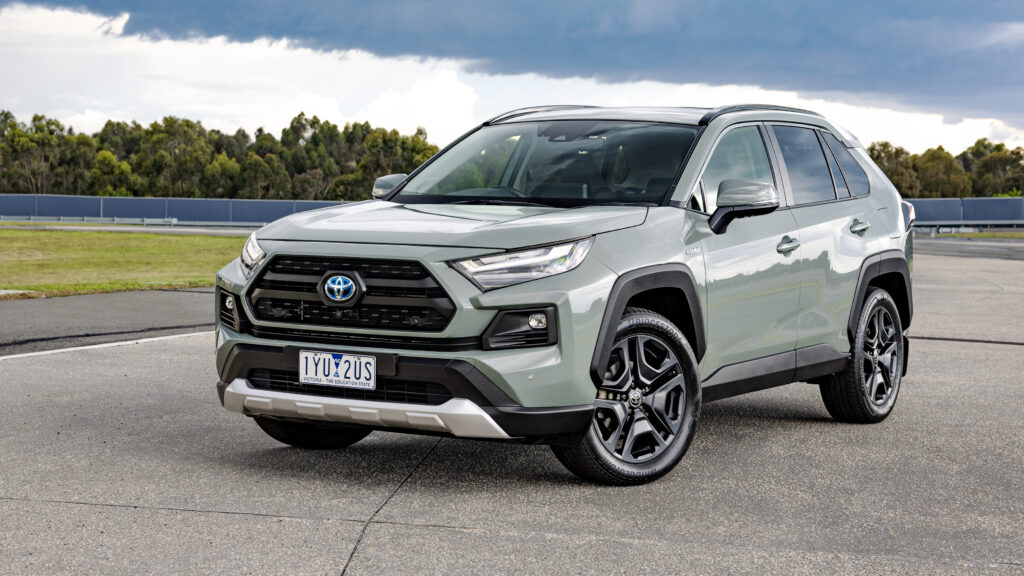
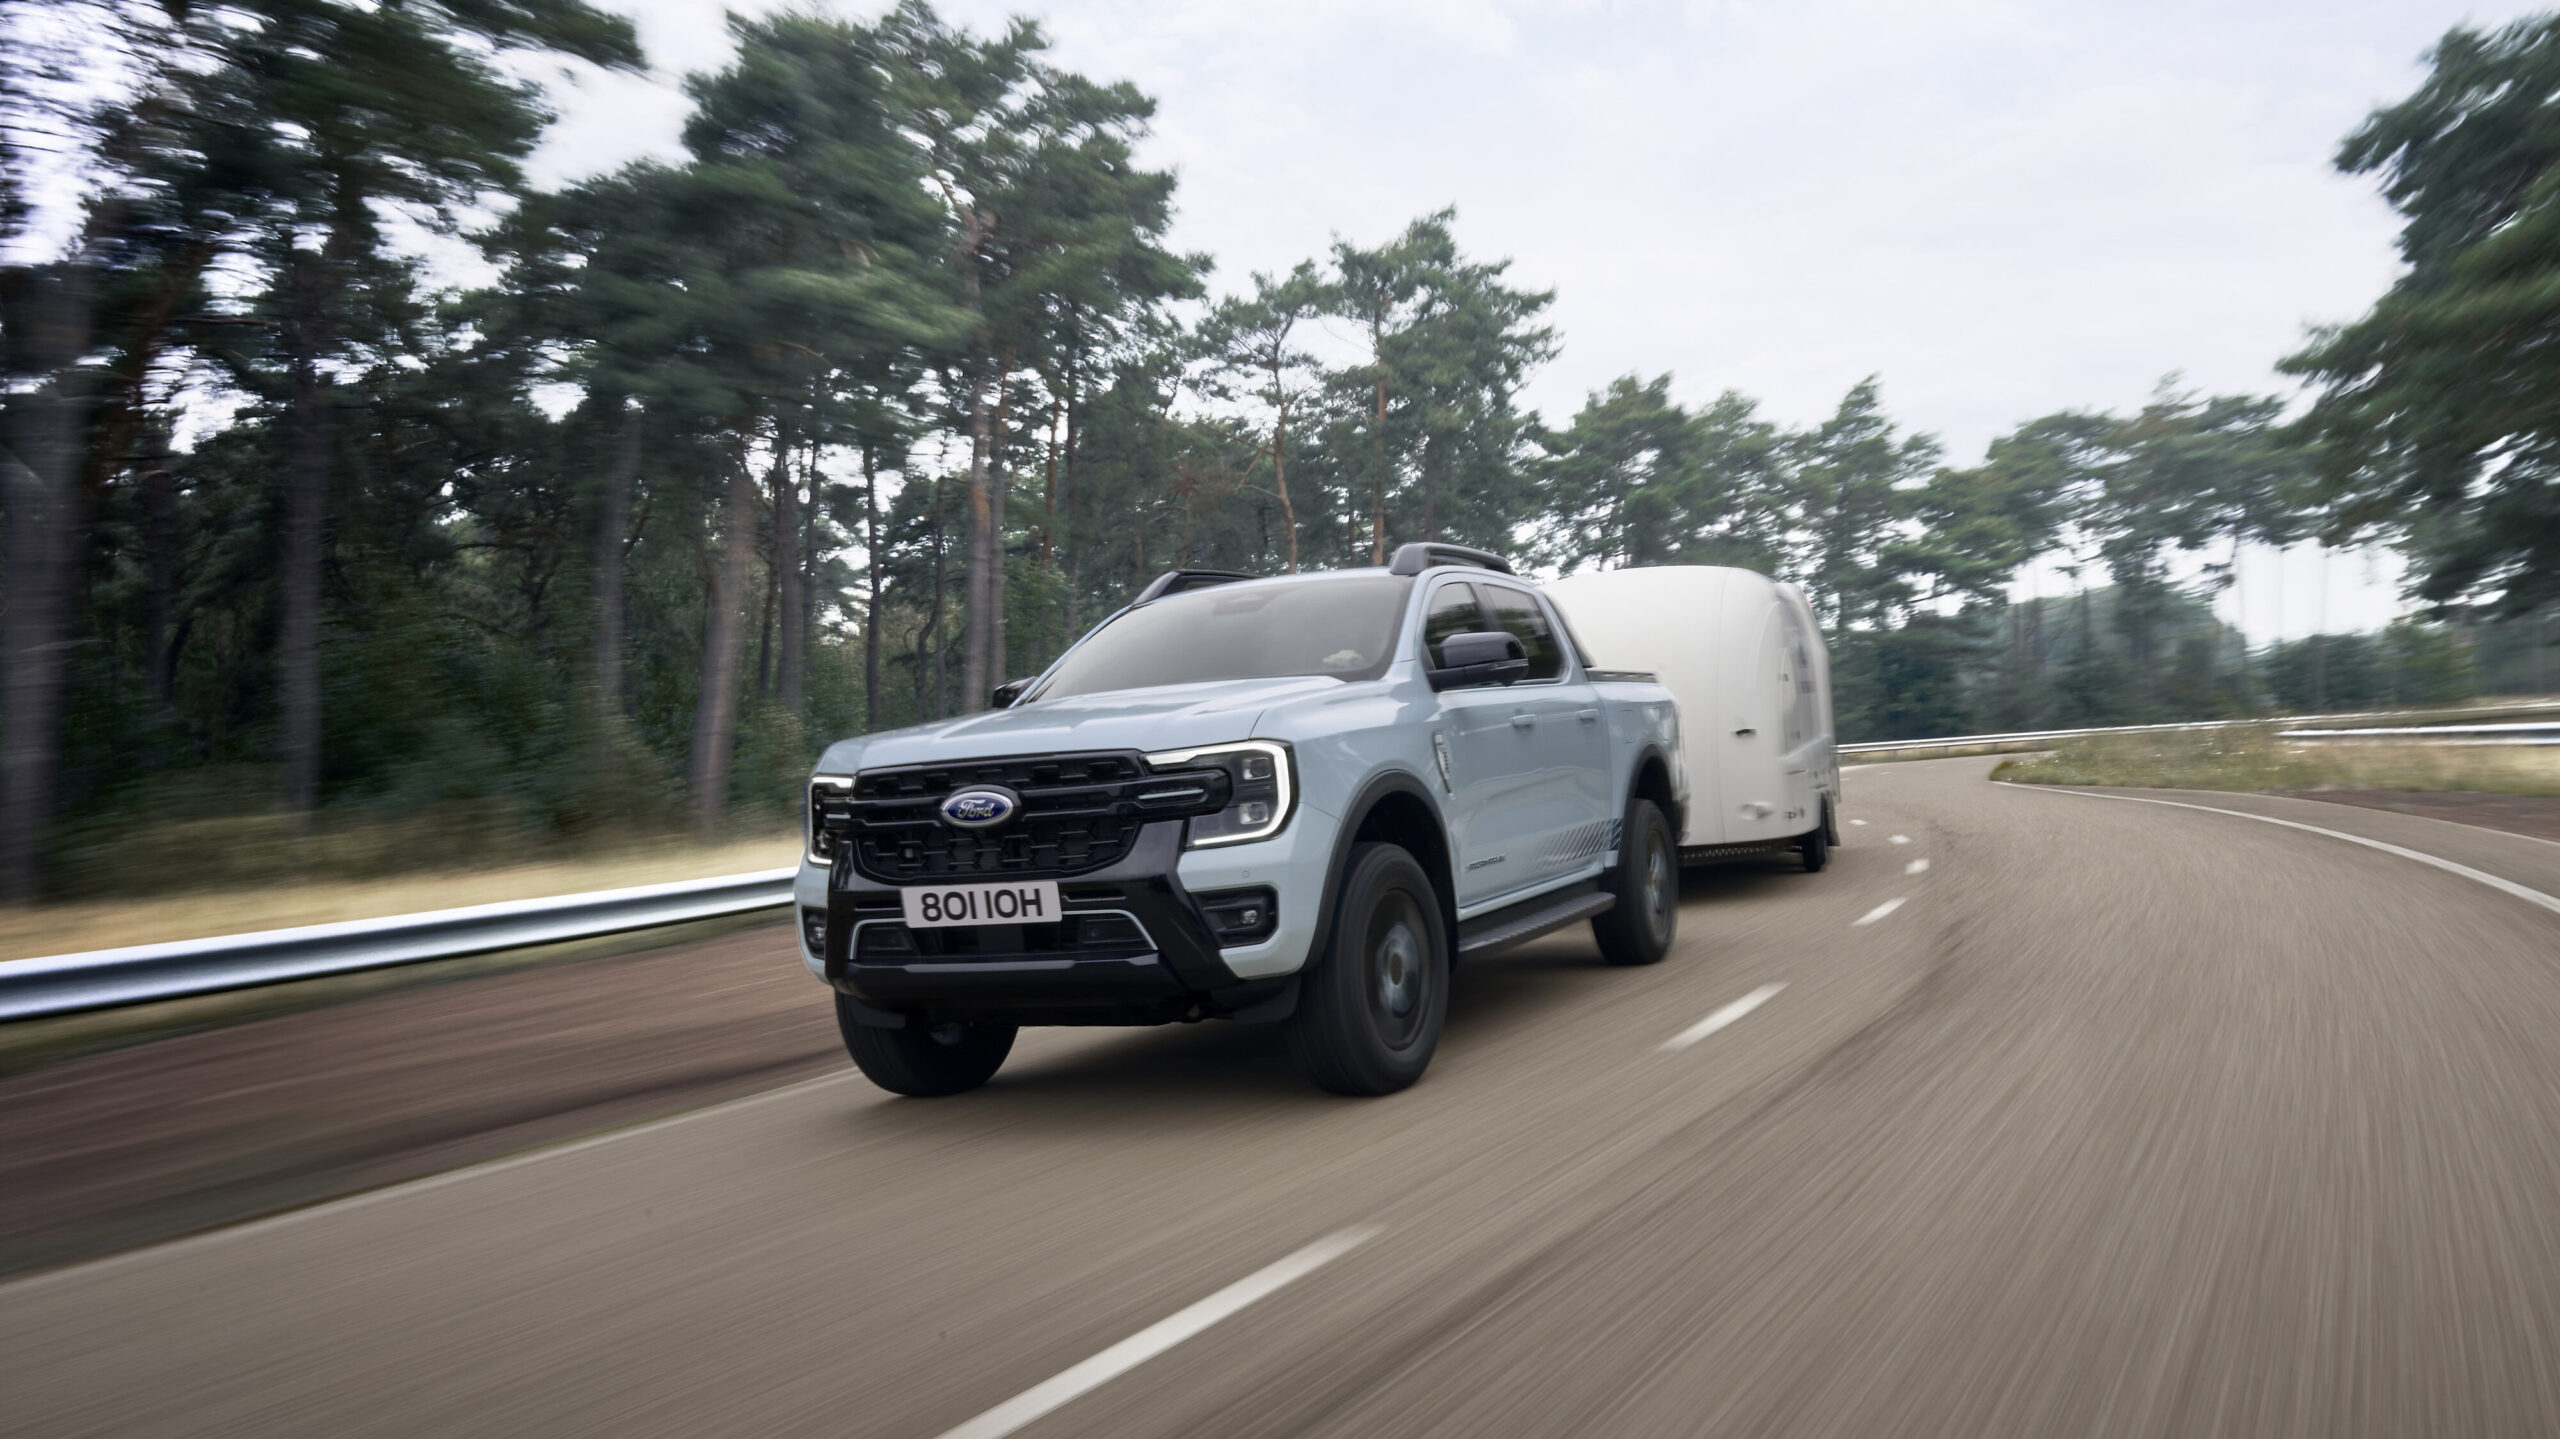
Toyota maintained its dominance in December 2024, with 18,657 cars sold, followed by Ford (8,305), Mazda (7,256), Kia (6,302), and Mitsubishi (5,754). The Toyota RAV4 topped the sales charts with 5,119 units, followed by the Ford Ranger, Toyota HiLux, Toyota Prado, and Ford Everest.
For the full year, Toyota led the market with 241,296 sales, capturing 19.8% of the market share. Ford (8.2%), Mazda (7.9%), Kia (6.7%), and Mitsubishi (6.1%) rounded out the top five brands.
For December 2024 sales in:
- Australian Capital Territory were down 8.9 per cent on December 2023 to 1,221
- New South Wales was down 1.7 per cent to 28,200
- Northern Territory was down 10.6 per cent to 664
- Queensland decreased 4.4 per cent to 20,259
- South Australia also decreased by 13.5 per cent to 6,175
- Tasmania had a decrease of 11.5 per cent to 1,862
- Victoria decreased 2.7 per cent to 26,755
- Western Australia increased 9.2 per cent to 10,759.
2024 Summary by Class
| Class | Jan-24 | Feb-24 | Mar-24 | Apr-24 | May-24 | Jun-24 | Jul-24 | Aug-24 | Sep-24 | Oct-24 | Nov-24 | Dec-24 | Total |
| Passenger | 16,434 | 19,610 | 17,611 | 17,314 | 21,252 | 21,065 | 17,291 | 15,166 | 14,488 | 15,527 | 13,621 | 14,005 | 203,384 |
| SUV | 49,830 | 57,773 | 64,631 | 54,135 | 59,737 | 65,248 | 56,590 | 56,541 | 56,440 | 56,152 | 60,612 | 57,877 | 695,566 |
| Light Commercial | 20,601 | 23,765 | 23,061 | 21,413 | 25,317 | 27,880 | 21,707 | 22,496 | 21,568 | 22,171 | 20,544 | 19,828 | 270,351 |
| Heavy Commercial | 2,917 | 3,875 | 4,344 | 4,340 | 4,793 | 5,466 | 3,898 | 4,125 | 4,524 | 4,525 | 4,314 | 4,185 | 51,306 |
| TOTAL | 89,782 | 105,023 | 109,647 | 97,202 | 111,099 | 119,659 | 99,486 | 98,328 | 97,020 | 98,375 | 99,091 | 95,895 | 1,220,607 |
Top Brands for Month of December 2024 YTD
| Rank | Brand | Year to Date (Dec-24) Volume | Year to Date (Dec-24) Share | Year to Date (Dec-23) Volume | Year to Date (Dec-23) Share | Month (Dec-24) Volume | Month (Dec-24) Share |
| 1 | Toyota | 241,296 | 19.8% | 215,240 | 17.7% | 18,657 | 19.5% |
| 2 | Ford | 100,170 | 8.2% | 87,800 | 7.2% | 8,305 | 8.7% |
| 3 | Mazda | 95,987 | 7.9% | 100,008 | 8.2% | 7,256 | 7.6% |
| 4 | Kia | 81,787 | 6.7% | 76,120 | 6.3% | 6,302 | 6.6% |
| 5 | Mitsubishi | 74,547 | 6.1% | 63,511 | 5.2% | 5,754 | 6.0% |
| 6 | Hyundai | 71,664 | 5.9% | 75,183 | 6.2% | 5,025 | 5.2% |
| 7 | MG | 50,592 | 4.1% | 58,346 | 4.8% | 4,218 | 4.4% |
| 8 | Isuzu Ute | 48,172 | 3.9% | 45,341 | 3.7% | 3,558 | 3.7% |
| 9 | Nissan | 45,284 | 3.7% | 39,376 | 3.2% | 4,224 | 4.4% |
| 10 | GWM | 42,782 | 3.5% | 36,397 | 3.0% | 4,073 | 4.2% |
Top 10 Models of December 2024 (by Sales Volume)
| Rank | Vehicle | Dec-24 | Dec-23 | % diff |
| 1 | Toyota RAV4 | 5119 | 2192 | 133.5% |
| 2 | Ford Ranger | 4493 | 7767 | -42.2% |
| 3 | Toyota HiLux | 3333 | 5143 | -35.2% |
| 4 | Toyota Prado | 2687 | 2475 | 8.6% |
| 5 | Ford Everest | 2476 | 1496 | 65.5% |
| 6 | Isuzu Ute D-Max | 2370 | 2833 | -16.3% |
| 7 | Kia Sportage | 2213 | 1546 | 43.1% |
| 8 | Nissan X-Trail | 2096 | 940 | 123.0% |
| 9 | Mitsubishi Outlander | 1991 | 1882 | 5.8% |
| 10 | Haval Jolion | 1691 | 1083 | 56.1% |
State/Territory Results (by Sales Volume)
| State/Territory | Dec-24 | Dec-23 | % diff |
| Australian Capital Territory | 1221 | 1340 | -8.9% |
| New South Wales | 28200 | 28675 | -1.7% |
| Northern Territory | 664 | 743 | -10.6% |
| Queensland | 20259 | 21188 | -4.4% |
| South Australia | 6175 | 7135 | -13.5% |
| Tasmania | 1862 | 2105 | -11.5% |
| Victoria | 26755 | 27508 | -2.7% |
| Western Australia | 10759 | 9850 | 9.2% |
Top Selling Cars of 2024
| Rank | Model | Volume 2024 | Change year-on-year |
| 1 | Ford Ranger | 62,593 | down 1.2 per cent |
| 2 | Toyota RAV4 | 58,718 | up 98.2 per cent |
| 3 | Toyota HiLux | 53,499 | down 12.5 per cent |
| 4 | Isuzu D-Max | 30,194 | down 3.2 per cent |
| 5 | Mitsubishi Outlander | 27,613 | up 13.8 per cent |
| 6 | Ford Everest | 26,494 | up 75.8 per cent |
| 7 | Toyota Corolla | 24,027 | up 20.2 per cent |
| 8 | Mazda CX-5 | 22,835 | down 1.1 per cent |
| 9 | MG ZS | 22,629 | down 22.7 per cent |
| 10 | Kia Sportage | 22,210 | up 41 per cent |
Source: VFACTS, Federal Chamber of Automotive Industries